Directions: Copy and paste each diagram into your google slides presentation. (Don't forget to cite!) Make TWO conclusions about your diagram
- Example 1: Explain the diagram with references to specific countries. For example in America, the desertification level is...while in Northern Africa it is...
- Example 2: Explain the diagram with reference to parts of the United States. On the eastern side of the United States it is...The west coast.... etc.
SOIL EROSION
 IMAGE URL: http://www.acegeography.com/uploads/1/8/6/4/18647856/9422887_orig.gif
WATER POLLUTION
In order to learn more about water stress indication, read more at:http://www.sswm.info/category/concept/water-cycle
Is it good to be over exploited? What does this mean? What parts of the world is water as a resource a problem? Not a problem?
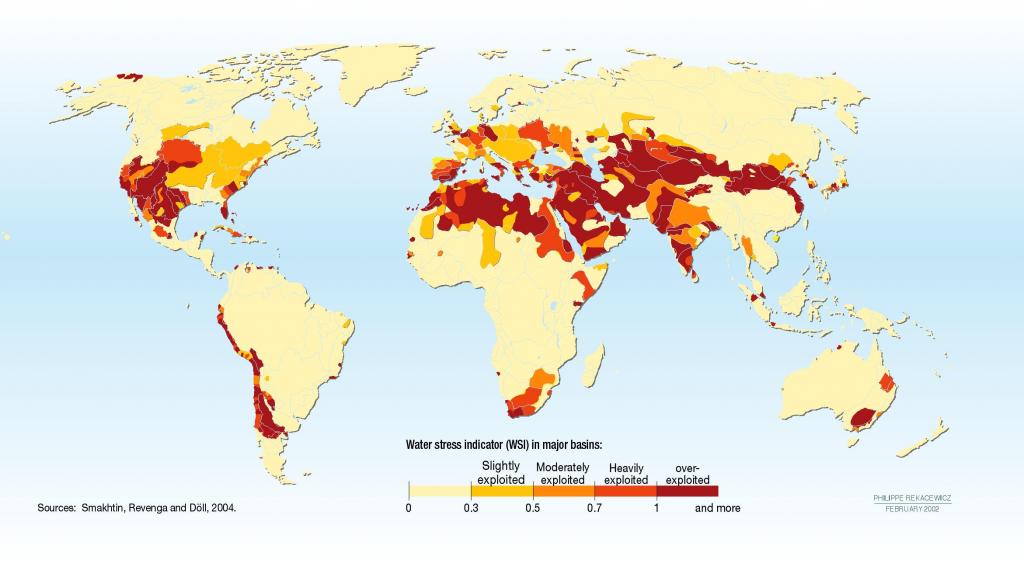
IMAGE URL: http://www.sswm.info/sites/default/files/toolbox/REKACEWICZ%202009%20Water%20Scarcity.jpg
AIR POLLUTION
In order to analyze this world map, you must do background research on this website: http://www.nasa.gov/topics/earth/features/health-sapping.html

IMAGE URL: http://www.nasa.gov/images/content/483910main1_Global-PM2.5-map-670.jpg
No comments:
Post a Comment